What Types of IoT Apps Are Companies Building?
IoT Analytics counted 18.8 billion connected IoT devices in 2025, and the projection puts that near 30 billion by 2030. None of that growth is just consumer gadgets. A lot of it is industrial sensors, fleet trackers, medical wearables, smart buildings, farm monitors. And here's the part people underestimate: every one of those verticals wants a different architecture.
Fleet and asset tracking is the biggest IoT segment by sheer deployment volume. Put a GPS device on a truck or a container and it ships location, speed, and diagnostic data every 10 to 60 seconds over the cellular network. The app turns that into live maps, route history, geofence alerts, fuel-consumption patterns. We've built IoT systems tracking 30,000+ vehicles in production. Our Pixytan platform runs the geofencing, speed alerts, and live tracking across Gujarat's road network, so this isn't theory for us.
Industrial monitoring is factory equipment, energy systems, environmental sensors. Temperature, vibration, pressure, humidity, all of it reporting back to one platform. Readings cross a threshold and the system fires alerts, sometimes an automated shutdown if you wire it that way. Picture a steel plant with 2,000 sensors going off every 5 seconds. That's 400 data points a second slamming into your pipeline, and it never stops.
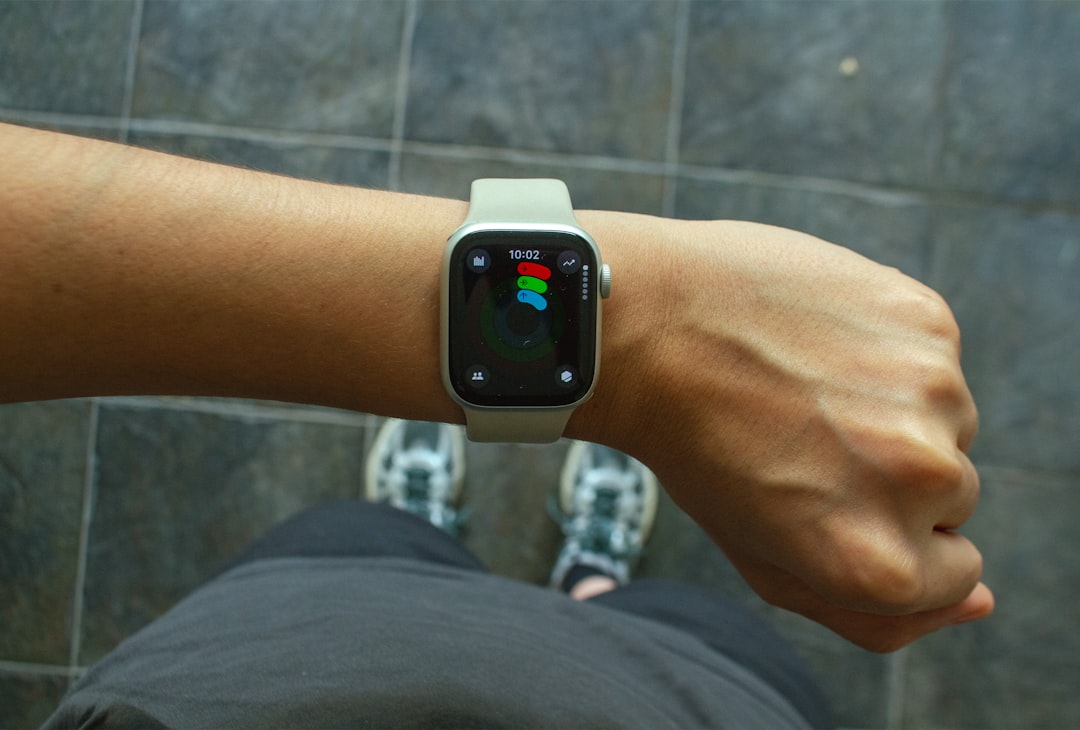
Connected healthcare means wearable monitors, remote patient devices, clinic equipment. A heart-rate, blood-pressure, SpO2, or glucose monitor sends its readings over BLE to a phone, and the phone relays them up to the cloud. Then HIPAA and GDPR compliance show up and add 20 to 30% to your build cost. Plan for it early.
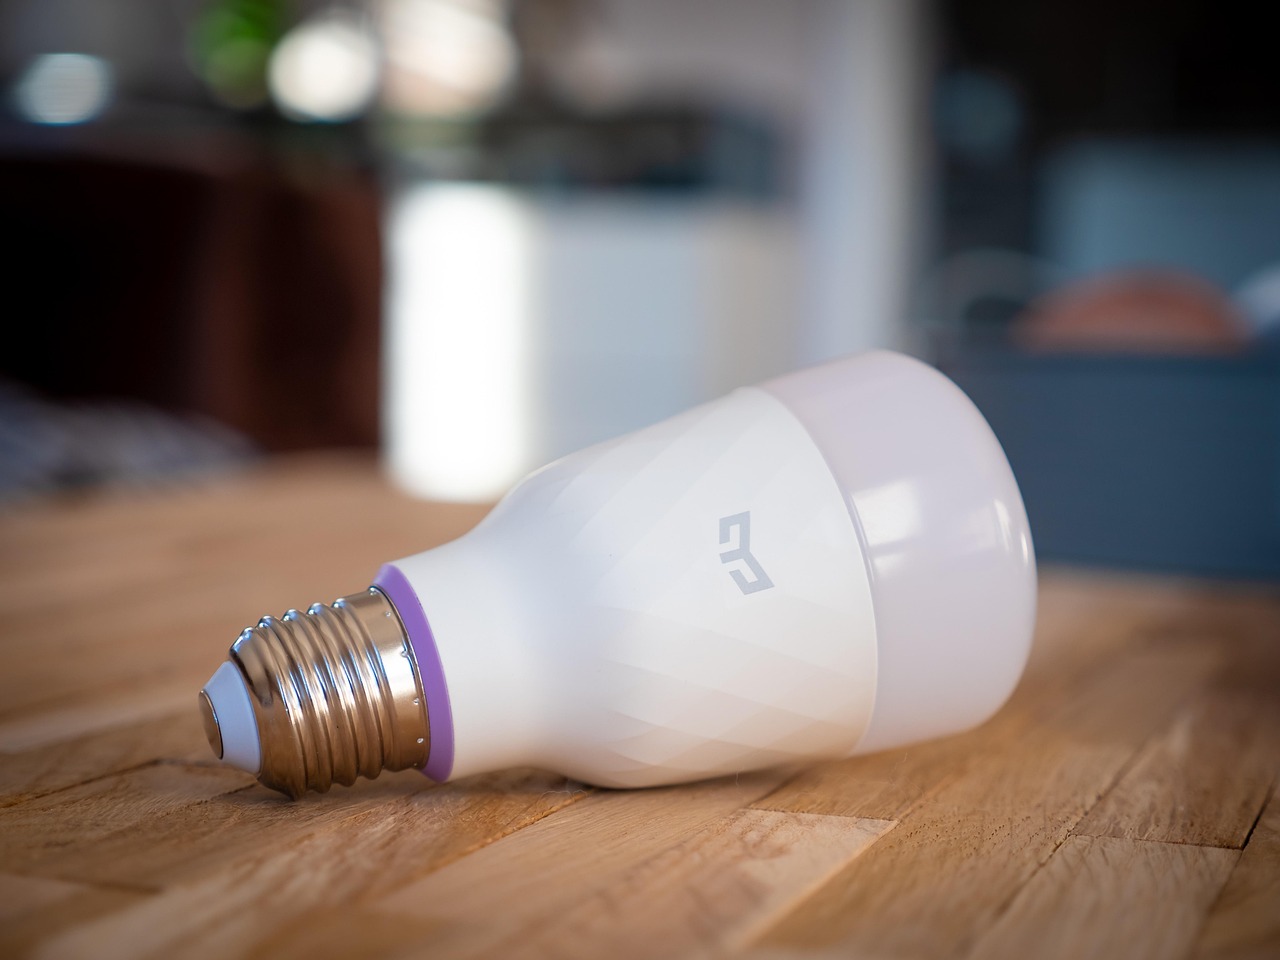
Smart home and building automation leans on Zigbee, Z-Wave, or plain WiFi to run lighting, HVAC, security cameras, door locks. The app handles remote control and scheduling, throws up energy-usage reports, and ties into a voice assistant like Alexa or Google Home for the people who want that.
So what ties every one of these together? Reliable data ingestion at scale, real-time processing, and dashboards people actually act on. The protocol changes. The device hardware changes. The compliance rules change by vertical. But underneath, the software architecture rhymes from one project to the next. For a closer look at how we handled fleet tracking in particular, read our fleet management software guide.
How Much Does IoT App Development Cost by Project Type?
McKinsey's IoT Value report puts the annual economic value of IoT at $5.5 to $12.6 trillion once you fold in productivity gains, cost savings, and new revenue lines. That's the upside. What it costs you to actually go capture a slice of it swings hard depending on the use case.
| Project Type | Cost Range | Timeline | Device Count | Key Components |
|---|---|---|---|---|
| Basic monitoring app | $40,000-$80,000 | 12-20 weeks | Up to 1,000 | Data ingestion, dashboard, alerts |
| Fleet/asset tracking | $60,000-$120,000 | 16-28 weeks | 1,000-50,000 | GPS, geofencing, route history, reports |
| Industrial IoT platform | $100,000-$180,000 | 24-36 weeks | 5,000-100,000 | Multi-sensor, edge, predictive analytics |
| Connected healthcare | $80,000-$150,000 | 20-32 weeks | 500-10,000 | BLE wearables, compliance, EHR integration |
| Enterprise IoT (full platform) | $150,000-$200,000+ | 32-48 weeks | 50,000+ | Edge computing, OTA, multi-protocol, ML |
Device count is the biggest cost lever, by far. Running 500 sensors and running 50,000 are not the same product wearing different paint. At 500 devices reporting every 30 seconds you're handling 1,000 messages a minute. Bump that to 50,000 devices and you're at 100,000 messages a minute. Your database, your message broker, your compute, none of it scales in a straight line as you climb.
Protocol complexity is the second driver. A WiFi-only device speaking MQTT straight to AWS IoT Core is about as simple as it gets. But put a BLE device that pairs to a phone gateway, which then relays to the cloud over a REST API, and now you've got two communication layers that fail in two different ways. Throw LoRa into the mix for long-range, low-power units out in rural areas and you're supporting three protocols at once. Each one is its own thing to debug.
We've load-tested our examination systems at 10 million+ requests per minute. That experience carries straight over to IoT. Same core problem really: swallow a huge volume of time-stamped data, do it fast, and don't blow past your latency budget while you're at it.
Which IoT Protocol Should You Use: MQTT, BLE, HTTP, or CoAP?
The Eclipse Foundation's 2025 IoT Developer Survey found that 83% of IoT developers use MQTT, which makes it the default for cloud-connected devices. That doesn't mean it's always right. Every protocol trades something away, and the trade is what decides which one fits your case.
| Protocol | Message Size | Power Usage | Range | Latency | Best For |
|---|---|---|---|---|---|
| MQTT | 2 bytes minimum | Medium | Unlimited (WiFi/cellular) | Low (sub-second) | Cloud telemetry, fleet tracking |
| BLE 5.0 | 251 bytes max | Very low | 30-100 meters | Low | Wearables, medical devices |
| HTTP/REST | Large (headers) | High | Unlimited (WiFi/cellular) | Medium | Config updates, file uploads |
| CoAP | 4 bytes minimum | Very low | Unlimited (UDP-based) | Low | Constrained devices, mesh networks |
| LoRaWAN | 51-222 bytes | Very low | 2-15 km | High (seconds) | Agriculture, rural monitoring |
| Zigbee | 127 bytes | Low | 10-100 meters (mesh) | Low | Smart home, building automation |
Reach for MQTT on anything with WiFi or cellular. The publish/subscribe model means a device never has to hold a persistent connection to one specific endpoint. A temperature sensor just publishes its readings to a topic, say factory/floor-3/temp/sensor-42. From there your dashboard, your alert engine, and your data pipeline can all subscribe and pull those messages on their own, independently of each other. EMQX and Mosquitto are the two brokers most teams pick. If you'd rather not run your own, AWS IoT Core gives you a managed MQTT broker.
MQTT's Quality of Service levels are where reliability lives or dies, so pick deliberately:// QoS 0: Fire and forget (fastest, possible loss)
client.publish('sensors/temp', '22.5', { qos: 0 });
// QoS 1: At least once delivery (may duplicate)
client.publish('sensors/temp', '22.5', { qos: 1 });
// QoS 2: Exactly once delivery (slowest, guaranteed)
client.publish('sensors/critical-alert', 'overheating', { qos: 2 });
BLE is for device-to-phone hops. Fitness trackers, glucose monitors, smart locks. They lean on BLE because it sips battery. The phone plays gateway here: it picks up the BLE data from the device and pushes it out to the cloud over its own internet connection. BLE 5.0 doubles the speed and quadruples the range of BLE 4.2, and its 251-byte payload is plenty for the kind of sensor readings these devices send.
CoAP is for the truly starved devices. When your microcontroller has 64KB of RAM and has to nurse a coin-cell battery for 5 years, CoAP over UDP comes in lighter than MQTT over TCP. It borrows the same request/response shape as HTTP but ships far smaller messages. You see it a lot in agricultural sensors and infrastructure monitoring, the places where thousands of devices have almost no power to spare.
How Do You Architect a Sensor Data Pipeline?
AWS reckons IoT deployments can pump out up to 1 TB of data per day per 10,000 devices. You're not going to dump that into a plain PostgreSQL table and walk away. IoT pipelines get built for one job: swallow high-volume, time-stamped writes and still answer queries in real time.
Four stages, and they always show up in the same order. Ingestion first: devices fire data over MQTT into a broker like EMQX or AWS IoT Core. Then processing, where a rules engine or stream processor (AWS Lambda, Apache Kafka) validates the message, reshapes it, and routes it onward. Storage comes next, a time-series database such as TimescaleDB or InfluxDB holding the data under automatic retention policies. Last is querying, where the dashboard and alert engine read back out with time-range filters.
Drawn out, the flow looks like this:Device (MQTT) → Broker (EMQX/AWS IoT Core)
→ Rules Engine (filter + transform)
→ Hot path: Real-time alerts (if threshold exceeded)
→ Warm path: TimescaleDB (queryable for 90 days)
→ Cold path: S3 (archived indefinitely, $0.023/GB)
On IoT, a time-series database isn't optional. TimescaleDB bolts hypertables onto PostgreSQL, and those partition your data by time on their own. You keep full SQL, and you pick up time-series helpers like time_bucket() for downsampling. InfluxDB is the other route. It writes faster and gives you retention policies out of the box, though you trade your SQL for its own query language (Flux). Either one will take 100K+ inserts per second on a single node.
| Database | Writes/Second | Query Language | Retention Policies | Best For |
|---|---|---|---|---|
| TimescaleDB | 100K+ (single node) | SQL | Manual (via policies) | Teams that know SQL |
| InfluxDB | 250K+ (single node) | Flux / InfluxQL | Built-in automatic | Write-heavy workloads |
| AWS Timestream | Managed (auto-scale) | SQL-like | Built-in tiered storage | AWS-native stacks |
| QuestDB | 1.4M+ (single node) | SQL | Manual | Extreme write performance |
Tiered retention is where you stop bleeding money. Hot data, the last 24 hours, stays in memory so dashboard queries come back instantly. Warm data, the last 90 days, sits in TimescaleDB for the historical stuff. Anything older, 90 days and up, gets shoved to S3 at $0.023/GB a month. A retention policy moves it between tiers for you. And honestly, most IoT dashboards never look past the last 7 days, so there's no good reason to keep 12 months of raw sensor data parked in an expensive database.
Edge computing just drags the processing closer to the device. Rather than streaming raw accelerometer data at 50 readings a second up to the cloud, an edge processor crunches it locally and sends one summary every 30 seconds. That alone cuts bandwidth by 95% and cloud costs by 80%. If you want it managed, AWS Greengrass and Azure IoT Edge are the two to look at. For this exact pattern running in fleet tracking, read our Twings GPS case study.
What Does Device Management and OTA Updates Involve?
Gartner pegs it at 75% of IoT projects blowing their timeline because of device management complexity. The sensor and the app are the visible parts, the bits everyone budgets for. Running 10,000 deployed devices is where the time actually goes. Provisioning them, watching their health, pushing firmware, cleaning up when one fails. That's where the real engineering hides.
Provisioning comes first. Every device needs a unique identity (a device ID plus an X.509 certificate), its config (reporting interval, server endpoint, alert thresholds), and a credential to authenticate against the MQTT broker. At 100 devices you can sit there and set each one up by hand. At 10,000 you can't, you need an automated provisioning pipeline. AWS IoT Core does fleet provisioning with templates: a new device boots, hits a provisioning endpoint, gets handed its certificate and config, and starts reporting. No manual touch per device, which is the whole point.
Device shadows, sometimes called digital twins, hold the state for you. A shadow is just a JSON document up in the cloud that mirrors each device's last known state. Device drops offline? The shadow can still answer "what was the last temperature reading?" or "is this thing healthy?" Then the device comes back, syncs against the shadow, and catches up on whatever commands were waiting for it.
OTA firmware updates are the part that keeps you up at night. Push a bad update to 10,000 devices and you've just bricked 10,000 devices that you cannot physically reach to fix. So here's the pattern that keeps you safe. Upload the new firmware to a CDN or S3. Create an update job aimed at one device group. Ship it to 5% of devices first as a canary, then sit on your hands and watch for 24 hours. Only after that do you roll out in batches of 10 to 20%, with automatic rollback armed in case error rates spike.
A health-check query we lean on looks like this:-- Find devices that stopped reporting in the last hour
SELECT device_id, last_seen, firmware_version
FROM device_registry
WHERE last_seen < NOW() - INTERVAL '1 hour'
AND status = 'active'
ORDER BY last_seen ASC;
Then there's battery management for the wireless units. A GPS tracker on a 3,000mAh battery, reporting over cellular every 10 seconds, gives you maybe 3 to 7 days. Drop it to 60-second intervals with sleep mode between transmissions and the same battery stretches to 30 to 60 days. So your management platform has to watch battery levels, guess at replacement dates, and warn the operators before a device goes dark on them.
Certificate rotation is a security must, not a nice-to-have. Device certificates expire, usually after 1 to 2 years. Before that day comes, the device has to ask your provisioning service for a fresh certificate, check it, and cut over to it without any downtime. AWS IoT Core automates the rotation for you. Go self-managed, though, and that rotation logic is something you bake into the firmware yourself.
How Do You Build Real-Time IoT Dashboards?
Grafana Labs says over 20 million users run their dashboarding platform for IoT monitoring. Dashboards aren't just pretty charts though. In IoT they're the layer that sits between raw sensor data and a human deciding what to do about it. A good one takes 100,000 data points and hands you three things worth acting on.
Pre-built or custom? It depends on who's looking. When your users are technical, ops teams and engineers, Grafana is the obvious pick. It plugs straight into TimescaleDB and InfluxDB, streams in real time, and ships 100+ visualization types. But hand Grafana to a fleet manager or a building operator or a healthcare provider and it's wrong for them. Those users get a custom React or Next.js dashboard built around how they actually work.
| Approach | Cost | Timeline | Customization | Best For |
|---|---|---|---|---|
| Grafana (self-hosted) | $5,000-$10,000 | 2-4 weeks | Templates + plugins | Internal ops teams |
| Grafana Cloud | $500-$2,000/month | 1-2 weeks | Templates + plugins | Quick setup, managed |
| Custom (React + D3.js) | $20,000-$40,000 | 6-10 weeks | Full control | Customer-facing apps |
| Custom (Next.js + Recharts) | $15,000-$30,000 | 5-8 weeks | Full control | SaaS product dashboards |
For live updates, it's WebSocket or SSE. The dashboard subscribes to a WebSocket channel, and the moment new sensor data lands in the pipeline the server pushes it out to every connected client within 1 to 3 seconds. If you only ever push server-to-client and never need anything coming back the other way, Server-Sent Events (SSE) is the simpler choice. SSE holds up fine for 50 concurrent dashboard users. Past 500, WebSocket backed by Redis pub/sub handles the fan-out a lot more gracefully.
The widgets that actually earn their place on an IoT dashboard? A live map with device locations color-coded green, yellow, red so status reads at a distance. A time-series chart for the last 24 hours of whatever metric you've selected. An alert feed listing triggered alerts newest-first. A device health table showing battery level, firmware version, last-seen timestamp, signal strength. And a comparison chart that puts trends across device groups side by side. That's the set we keep coming back to.
For fleet and asset tracking, geofencing visualization is the thing that matters most. You draw polygons on the map to mark out zones, a warehouse, a delivery area, a restricted area. When a device crosses into or out of one, the system fires an alert and logs it. The dashboard then plots those boundary crossings as timeline events right next to the map. Our custom development team has built exactly this kind of geofencing for fleet platforms running tens of thousands of vehicles.
Keep load time under 2 seconds. Pre-aggregate the common time ranges, last hour, last day, last week, so the dashboard never has to grind through raw data on the fly. Cache the device metadata you read constantly in Redis. Lazy-load any chart that starts below the fold. None of this is busywork: a slow dashboard means operators miss alerts, and in industrial IoT a missed alert can mean wrecked equipment or someone getting hurt.